Attenuated Total Reflectance (ATR)
$99 Base price View My Quote RequestWhite Light Interferometry (WLI)
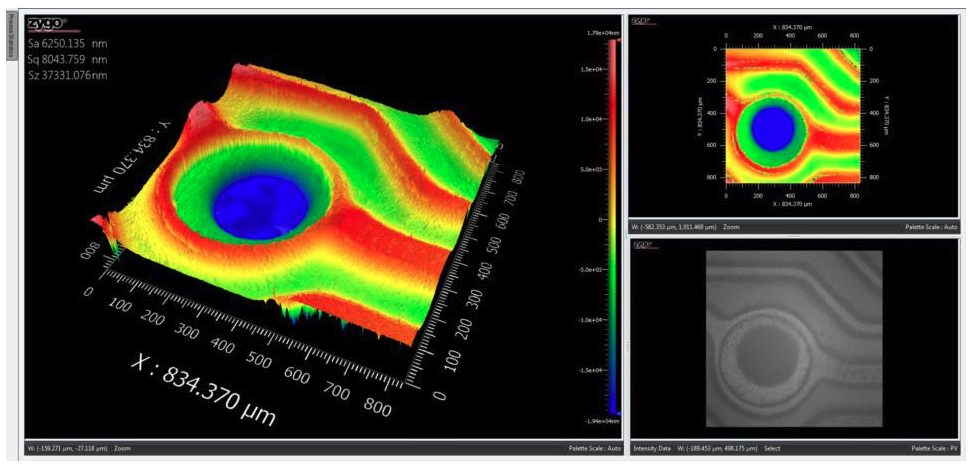
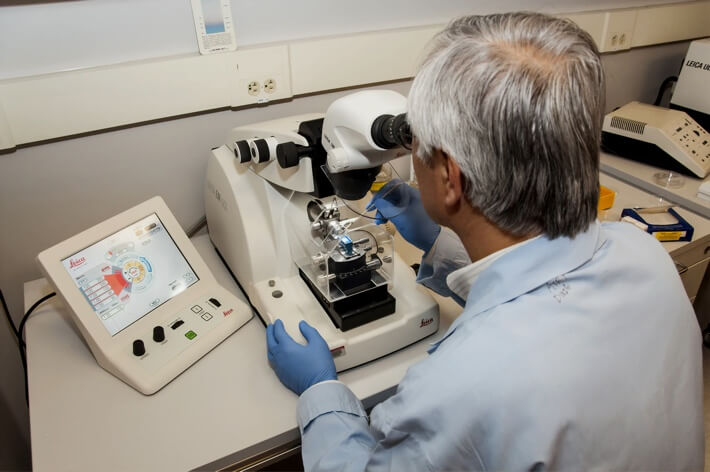
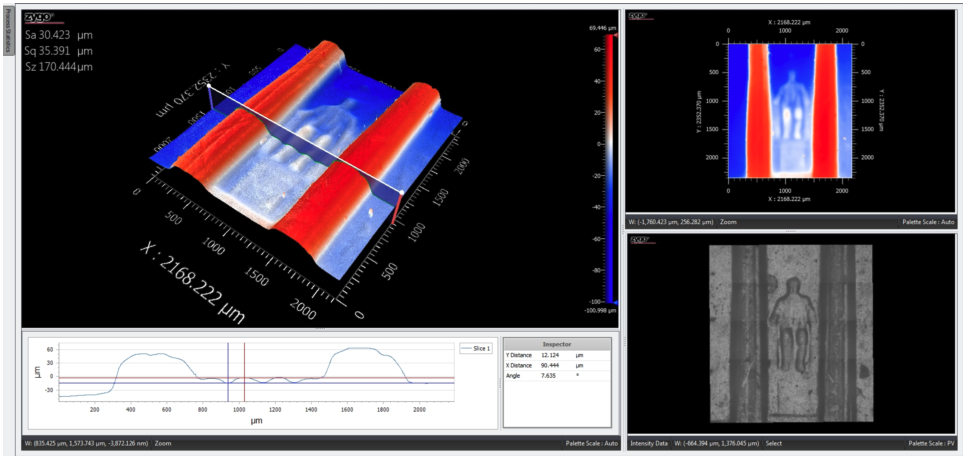
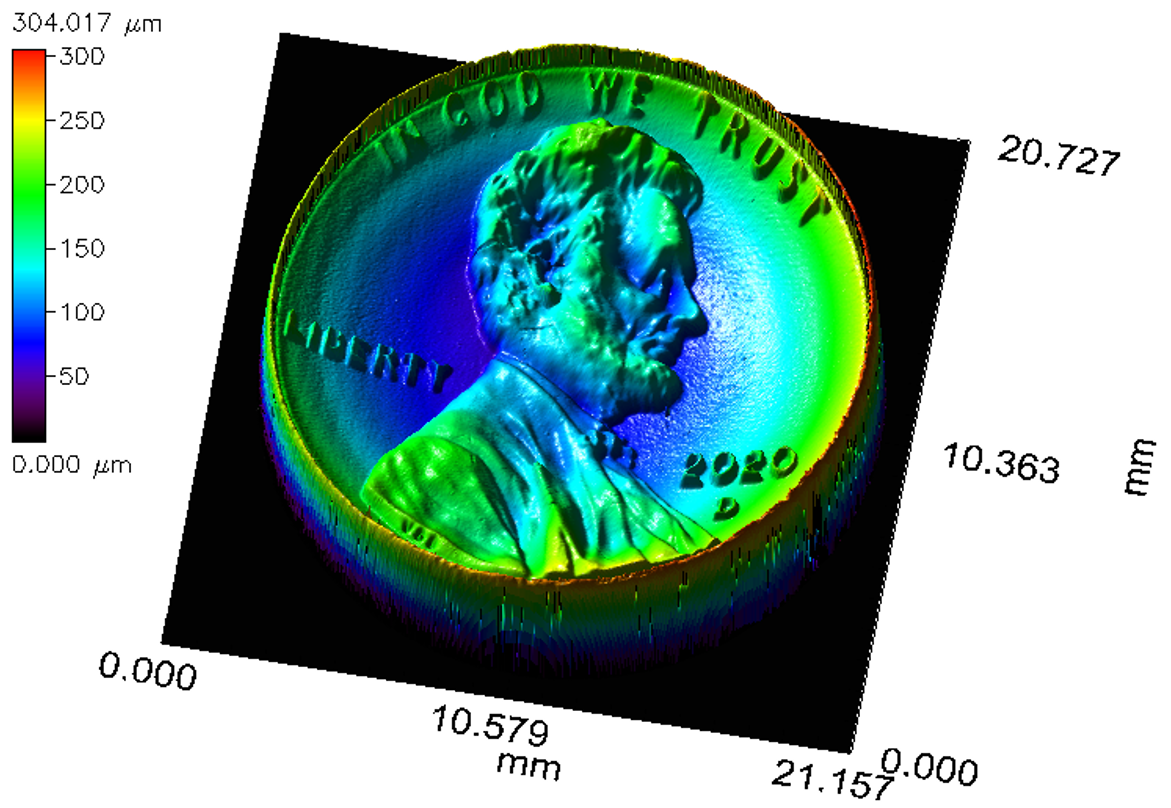
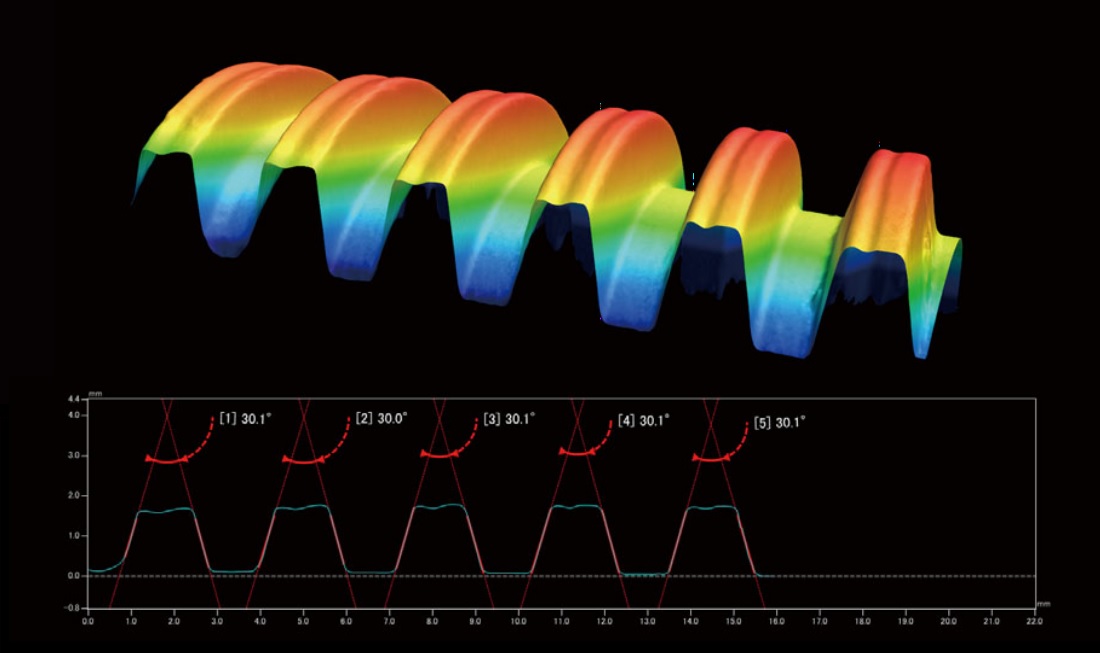
White light interferometry (WLI) is a nondestructive, non-contact, optical surface topography measurement which uses coherence scanning interferometry to generate 2D and 3D models of surface height.
Strengths
- Rapid results
- Superior lateral resolution (limit is ~160 nm) as compared to chromatic confocal, Laser Confocal and Wide Area Patterned Light Mapping
- Nondestructive measurement
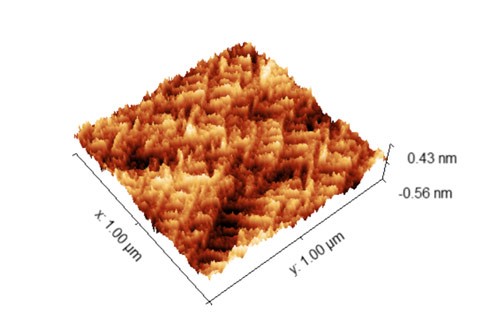
- High vertical resolution: ~1 nm
Limitations
- Steep cut-offs and sharp topography angles impair WLI measurement accuracy around these features
- Interpretation of fringe changes can be difficult in certain types of samples
Technical Specifications:
Learn More:

How WLI Works
WLI instruments use a white light source to illuminate the surface of the sample.
A beam-splitter divides the white light beam into two optical paths: one that reflects or scatters from the sample and one that reflects from a flat, known reference mirror. These two signal beams are then mixed together and the resulting image is projected onto a CCD image sensor.
The two beams, when mixed, form an interference pattern whose intensity can be related to the sample surface height: any difference in optical path length between the reference and sample beams changes the measured interference intensity at each scanned point, providing an indirect measure of the height variance in the sample.
The interference fringes are analyzed at each point to build up a 3D map of the sample surface.
Additional Resources

Optical Microscopy and Profilometry Services
IN Publications
July 21, 2021
Overview: Mid-Range Optical Profilometry
IN Publications
June 14, 2021
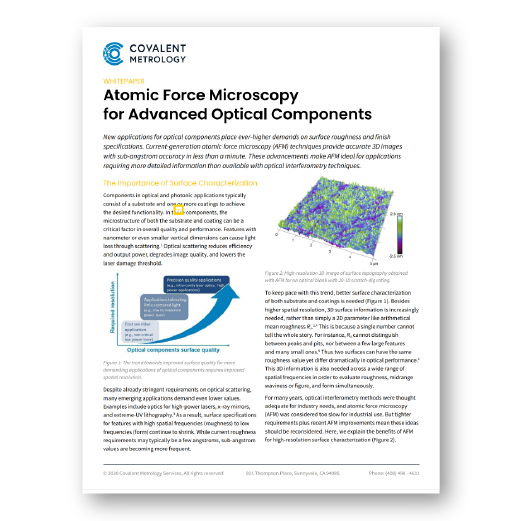
White Paper: Atomic Force Microscopy for Advanced Optical...
IN Publications
June 14, 2021

Choosing the Right Surface Imaging Technique
IN Publications
May 10, 2021
+
Add to Comparison
Digital Optical Microscopy (VH Microscope)
In Microscopy & Imaging
Optical microscopy is ubiquitous in diverse fields within academic research and commercial industries. It is an affordable, rapid...
+
Add to Comparison
Atomic Force Microscopy (AFM)
In Material Testing
AFM measures surface topography and certain material properties with sub-nm vertical resolution and atomic-level force sensitivity.
+
Add to Comparison
Chromatic Dispersion Profilometry (CWL)
In Microscopy & Imaging
Chromatic dispersion profilometry is a non-contact, nondestructive analytical technique used to measure surface topography. It is particularly well...
+
Add to Comparison
Scanning Acoustic Microscopy (SAM)
In Microscopy & Imaging
Scanning Acoustic Microscopy (SAM) is a non-destructive and non-invasive imaging technique which uses ultrasound signals to visualize the...
+
Add to Comparison
Scanning Electron Microscopy (SEM)
In Microscopy & Imaging
Scanning electron microscopy (SEM) is a surface imaging technique capable of achieving nm resolution on topographical features. Additionally,...
+
Add to Comparison
White Light Interferometry (WLI)
In Microscopy & Imaging
White light interferometry (WLI) is a nondestructive, non-contact, optical surface topography measurement which uses coherence scanning interferometry to...
+
Add to Comparison
Wide Area 3D Patterned Light Measurement (VR)
In Microscopy & Imaging
Wide Area 3D Patterned Light measurements encompass a class of optical profilometry techniques used to visualize the surface...
✕
Comparison link sent successfully
✕
Please use valid email address
✕
You need to have at least 2 techniques to compare
✕
You can select maximum 5 techniques
