Attenuated Total Reflectance (ATR)
$99 Base price View My Quote RequestRaman Microscopy (Raman)
Raman spectroscopy is a chemical analysis technique which probes the vibrational modes of compounds. It produces a spectrum which can provide fingerprint identification of materials when compared against a reference library of known standards.
Strengths
- High spatial resolution
- Signature can be used to identify chemical species
Limitations
- Low probability process needs significant excitation energy
- Energy levels used can damage some materials
- Non-linear phenomena
Technical Specifications:
Learn More:
Example Outputs
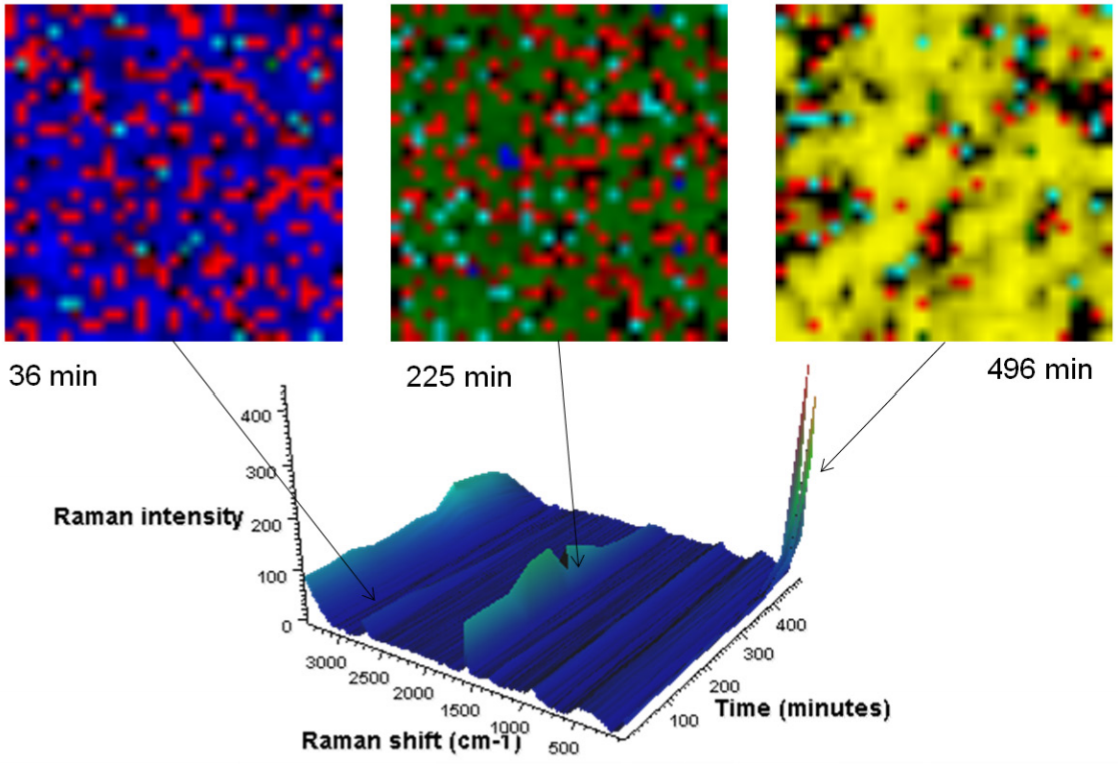
Raman images are presented in which the image contrast is generated by multivariate curve resolution (MCR) analysis. In this case, MCR finds the differences not only within each image but also across the entire time sequence. A different color is assigned to each resolved component. Each image is from the same 30 µm square portion of the anode. The blue MCR component is indicative of the 1580 cm-1 band; green the 1590 cm-1 band; yellow the 154 cm-1 band; red represents carbon black, a conductivity enhancer.
From: Thermo Scientific Application Note
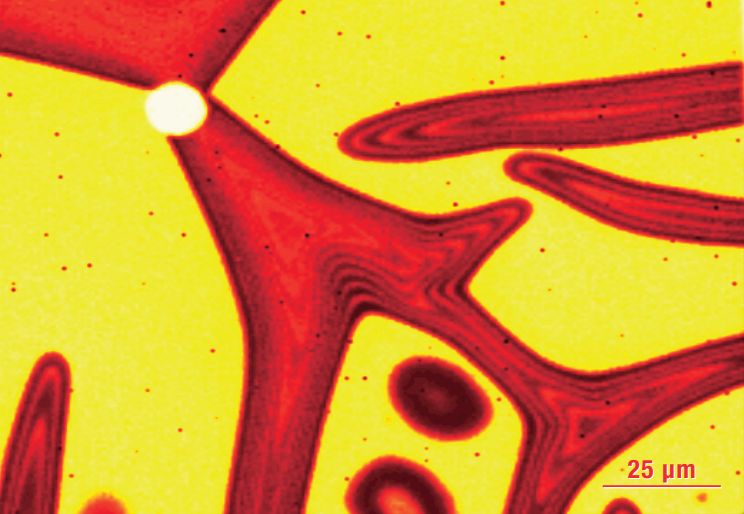
Raman map showing how the biaxial stress state induced by deposition of a semiconductor thin film on a lattice mismatched substrate illustrates the interplay between processing and physical properties.
From: Thermo Scientific
Instruments Used for Raman

Thermo Scientific DXR3xi
- Multiple Excitation Lasers:
- 455 nm
- 532 nm
- 785 nm
- Laser Power with precision controls: 0.1 mW power increments
- Spatial Resolution: better than 0.5 micron
- Confocal Depth Resolution: better than 2 micron
- Maximum image area: 101.6 mm x 76.2 mm
- View Instrument Spec Sheet
How Raman Works
Raman spectroscopy relies on the fact that a molecule (or element) when excited by optical illumination has a finite probability of emitting light which is slightly higher (or slightly lower) than the excitation wavelength.
Photons are emitted with a nonstandard wavelength, caused by the original atom/molecule either losing some energy (resulting in a lower-wavelength photon emission – called the “Stokes shift”) or gaining energy (“anti-Stokes”) from a vibrational energy change in the sample. This change in energy is dependent on the type of sample and the excitation wavelength.
Typically, Raman uses a tightly focused laser beam as the excitation source. Light emitted from the sample is high-pass filtered to remove the laser line and then the intensity as a function of wavelength is measured using a high-resolution spectrometer.
The spectroscopic signature of the Raman signal is often used to identify the type and nature of chemical compounds by comparing the sample signature against reference standards.

+
Add to Comparison
Fourier Transformed Infrared Spectroscopy (FTIR)
In Analytical Chemistry
Fourier-transformed infrared spectroscopy (FTIR) is a nondestructive, optical technique used to characterize optical properties of a material, and...
✕
Comparison link sent successfully
✕
Please use valid email address
✕
You need to have at least 2 techniques to compare
✕
You can select maximum 5 techniques
