Attenuated Total Reflectance (ATR)
$99 Base price View My Quote RequestDynamic Light Scattering (DLS)
Dynamic light scattering (DLS) is an indirect, high-throughput method for measuring the sizes – by hydrodynamic diameter (HDD) – of particles in a solution.
Strengths
- Fast, automated analysis = rapid results
- Accepts low sample concentrations
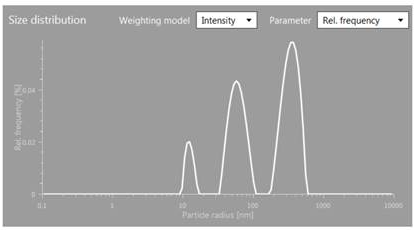
- Provides overall particle size distribution
- Works well with a wide range of particle sizes
- Nondestructive analysis
Limitations
- Does not provide particle shape information for irregular geometries
- Heavy particles can sometimes sediment, causing artifacts
- Bigger particles are higher-weighted in the raw intensity distribution
Technical Specifications:
Learn More:
Instruments Used for DLS
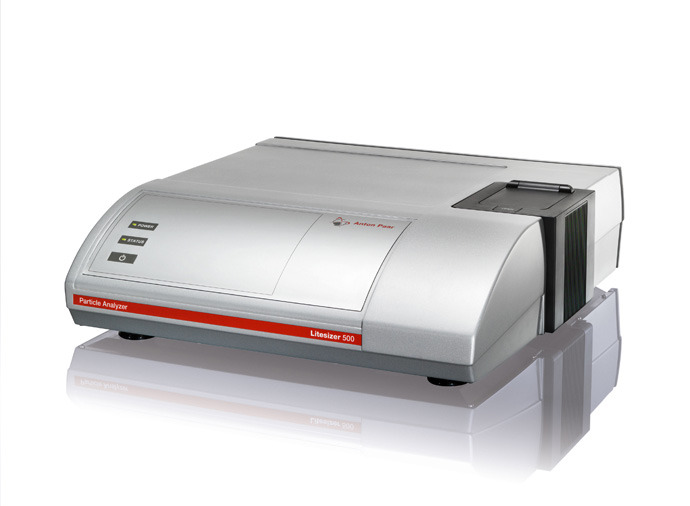
Anton Paar Litesizer 500
The Litesizer 500 from Anton Paar is the only DLS-based particle analyzer able to perform a straightforward measurement of the sample’s refractive index at the exact wavelength and temperature of a given measurement. This ensures its maximal accuracy for particle size and zeta potential analysis.
- Particle Diameter Range: 0.3 nm to 10 µm
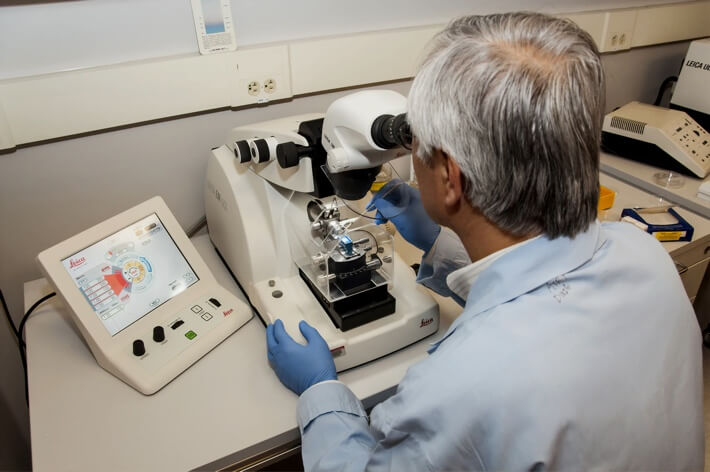
How DLS Works
Particles suspended in a liquid are constantly undergoing random Brownian motion, and their size directly affects their speed: smaller particles move faster than larger ones.
When a laser light source is applied to an aqueous sample of particles in solution, it scatters around them as it passes. The scattered light is detected and recorded at some pre-defined angles and the time-dependence of changes in the scattered intensity profiles can be correlated to the particles’ speed, and therefore to their average size and distribution throughout the system.
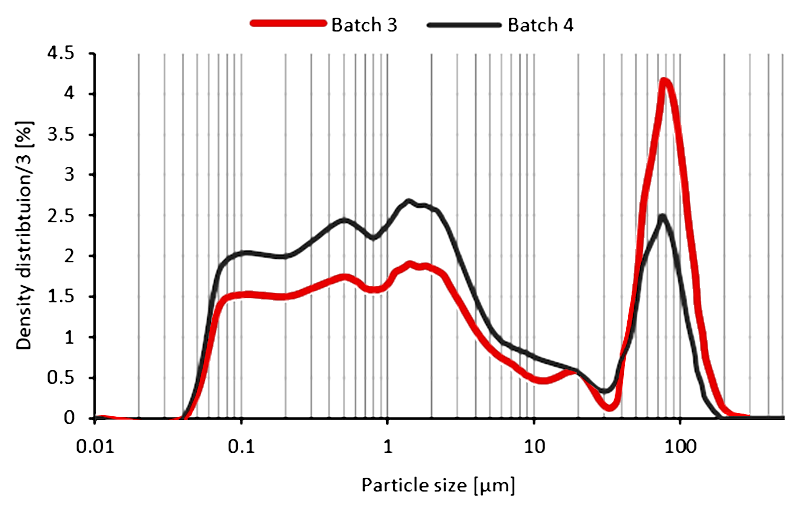
Plots of the relative frequency of distinct particle sizes and speeds can then be generated for subsequent analysis.
Additional Resources
Application Note: Droplet Size Matters: Bioavailability of CBD...
IN Publications
January 4, 2021
Application Note: Black and green: catalyst and membranes...
IN Publications
January 4, 2021
+
Add to Comparison
Laser Diffraction Particle Size Analysis (PSA)
In Particle Analysis
Particle size analysis (PSA) is an indirect, optical technique used to measure particle size distributions - by equivalent...
+
Add to Comparison
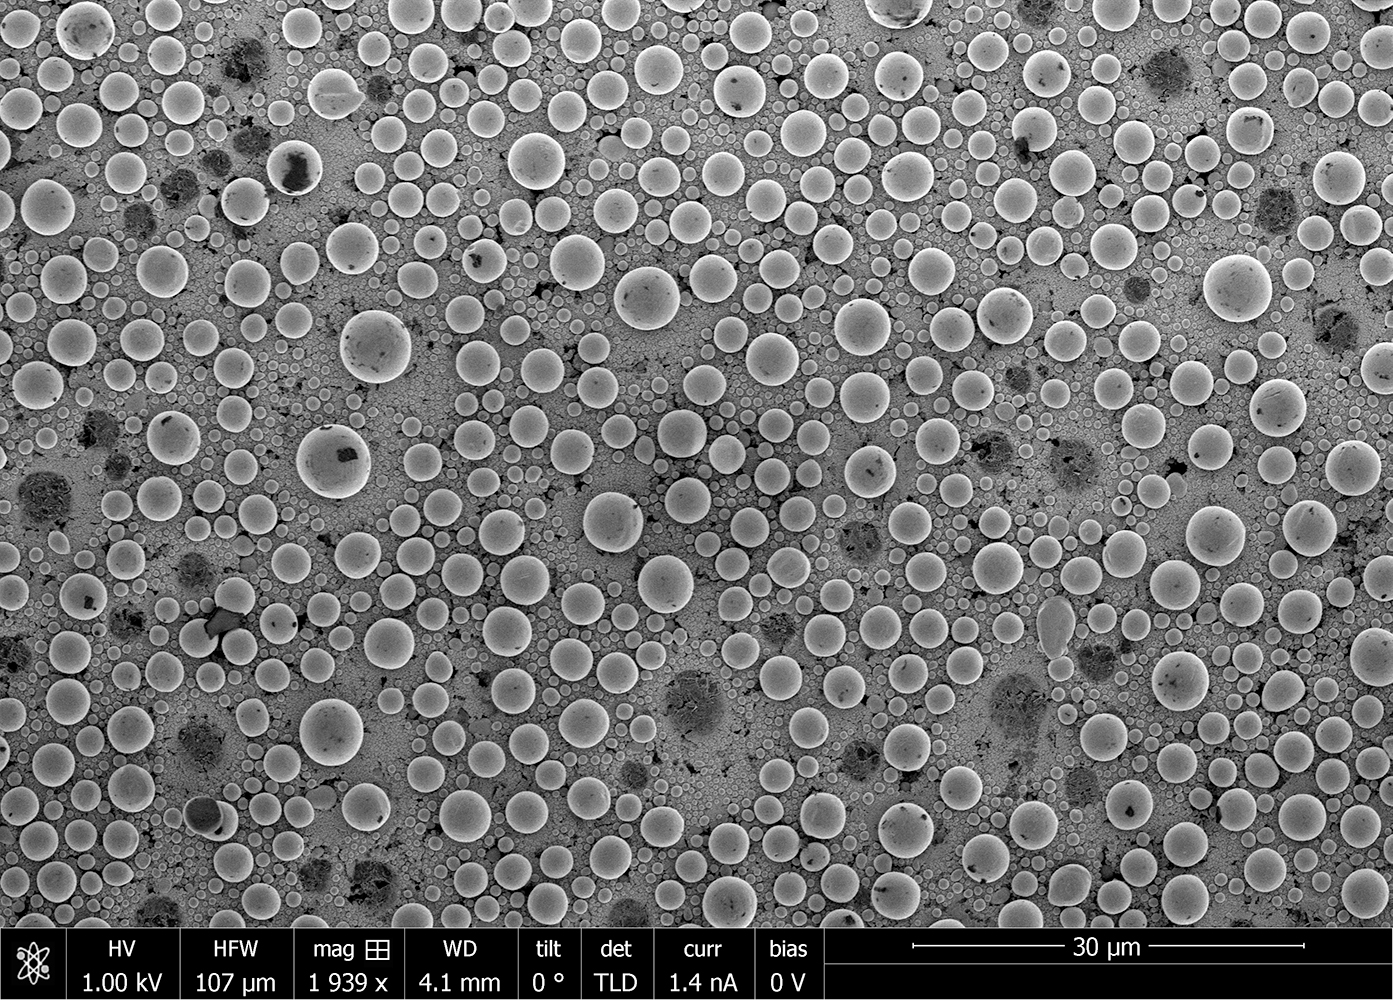
Scanning Electron Microscopy (SEM)
In Microscopy & Imaging
Scanning electron microscopy (SEM) is a surface imaging technique capable of achieving nm resolution on topographical features. Additionally,...
+
Add to Comparison
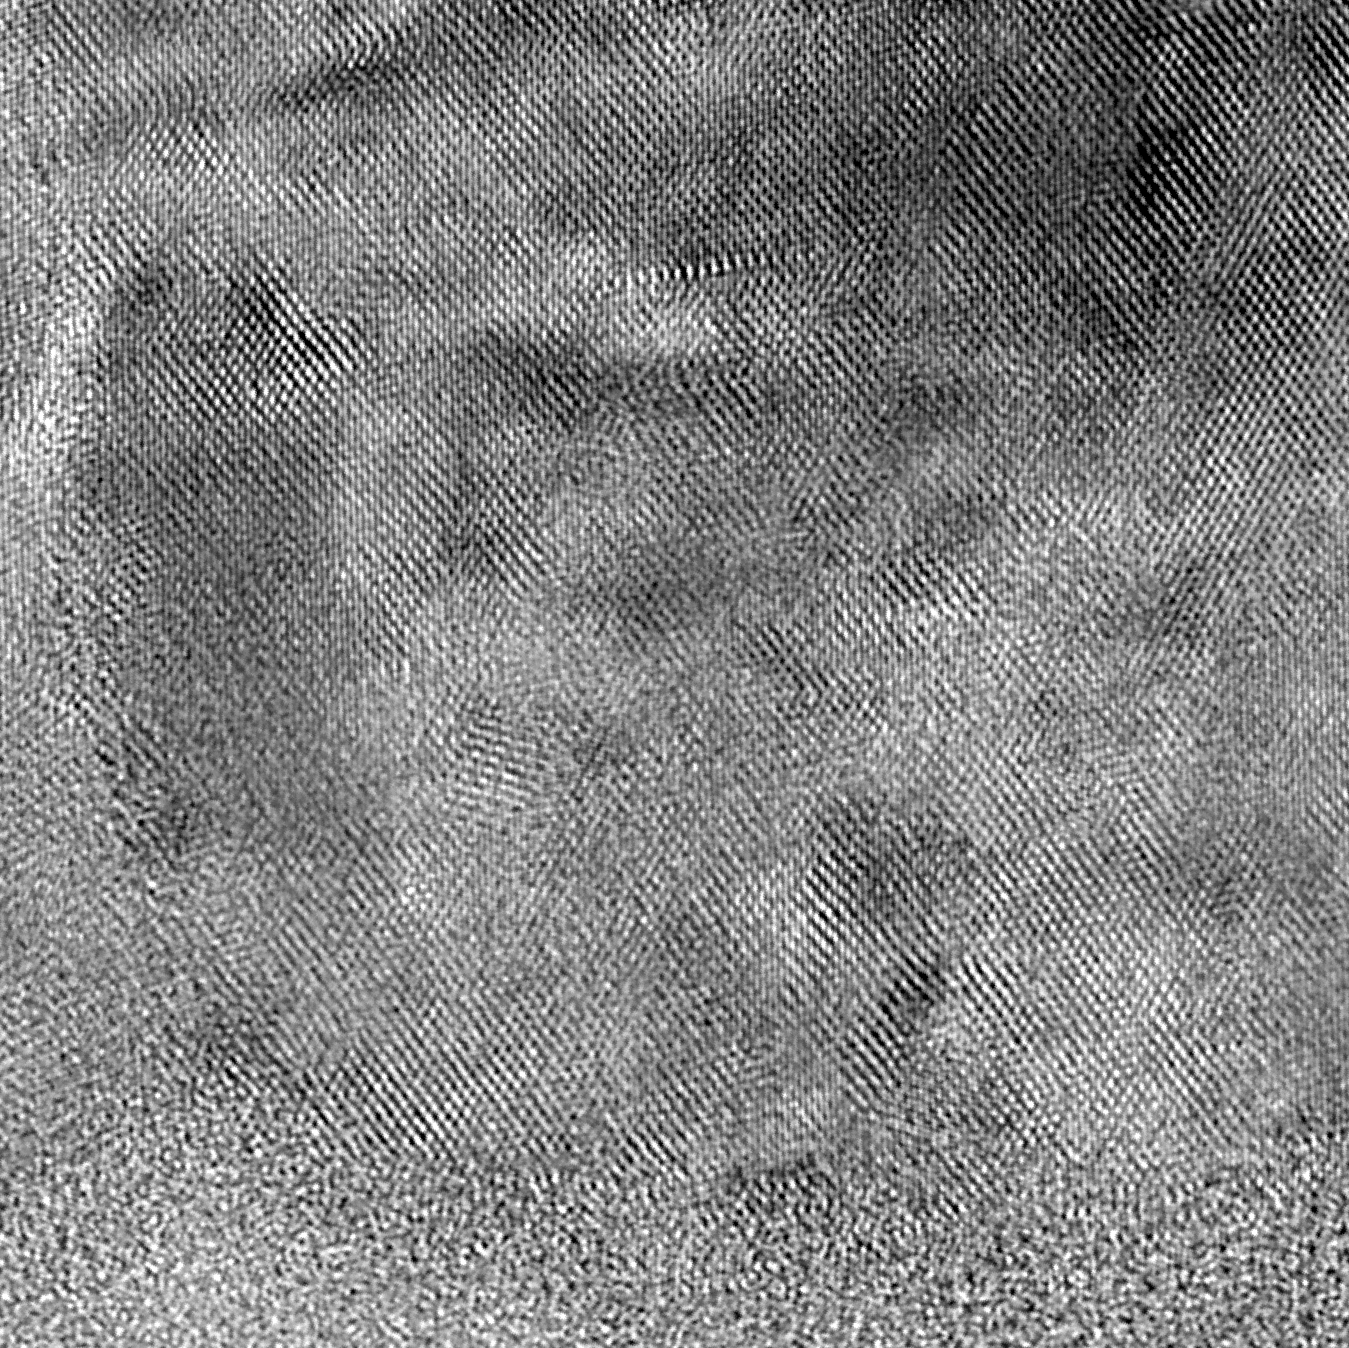
Transmission Electron Microscopy (TEM)
In Microscopy & Imaging
TEM is the highest-resolution imaging technique available today. It is used to visualize sample features with atomic-level spatial...
+
Add to Comparison
Zeta Potential
In Material Testing
Zeta potential measures the strength of net charge on particle and solid surfaces. The higher the magnitude of...
✕
Comparison link sent successfully
✕
Please use valid email address
✕
You need to have at least 2 techniques to compare
✕
You can select maximum 5 techniques
